More information
How ChartTheWind works
Reading a report
What the charts and tables are showing.
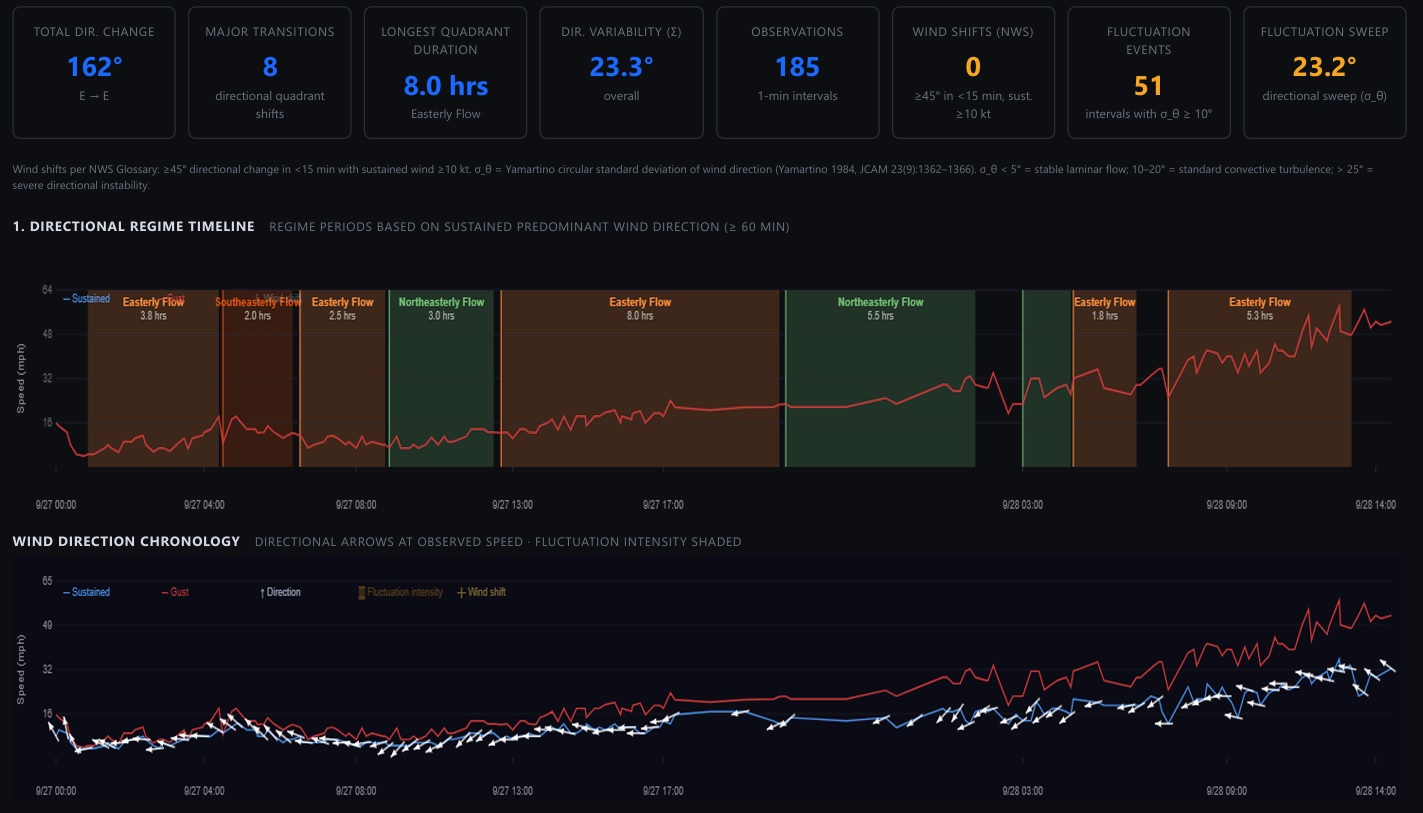
The pictures below come from a sample report for Hurricane Ian at one Fort Myers, FL address, September 27–28, 2022. They show how the wind’s direction and strength changed through the event, in plain terms.
The at-a-glance numbers and the direction timeline
Sample report: Hurricane Ian, Fort Myers, FL, 2022-09-27 to 2022-09-28
The row of tiles at the top is a quick summary of how the wind’s direction behaved:
- Total direction change and major transitions: how far the wind direction turned in total, and how many times it settled into a new general direction.
- Longest quadrant duration: the longest uninterrupted stretch from one general direction, here 8.0 hours of easterly wind.
- Direction variability and fluctuation: how jumpy the direction was. Steady wind holds its direction; turbulent, gusty wind wobbles back and forth. “Fluctuation events” counts the times the direction was noticeably unsteady.
- Wind shifts (NWS): a sharp turn of 45° or more in under 15 minutes while the wind was steady at 10 knots or more. This sample had none.
The direction timeline breaks the event into “regimes”: periods of at least an hour when the wind came mostly from one general direction, such as easterly or northeasterly. Each colored block is one regime and shows how long it lasted, and the red line underneath is the wind speed. A new direction only counts once it has held, so brief wobbles don’t get mistaken for a real change.
The direction chronology below it is the same event reading by reading. Each arrow shows which way the wind was blowing at that moment, the blue line is sustained wind, the red line is gusts, and shaded areas mark stretches where the direction was jumpy.
How long the wind came from each direction
Sample report: Hurricane Ian, Fort Myers, FL, 2022-09-27 to 2022-09-28
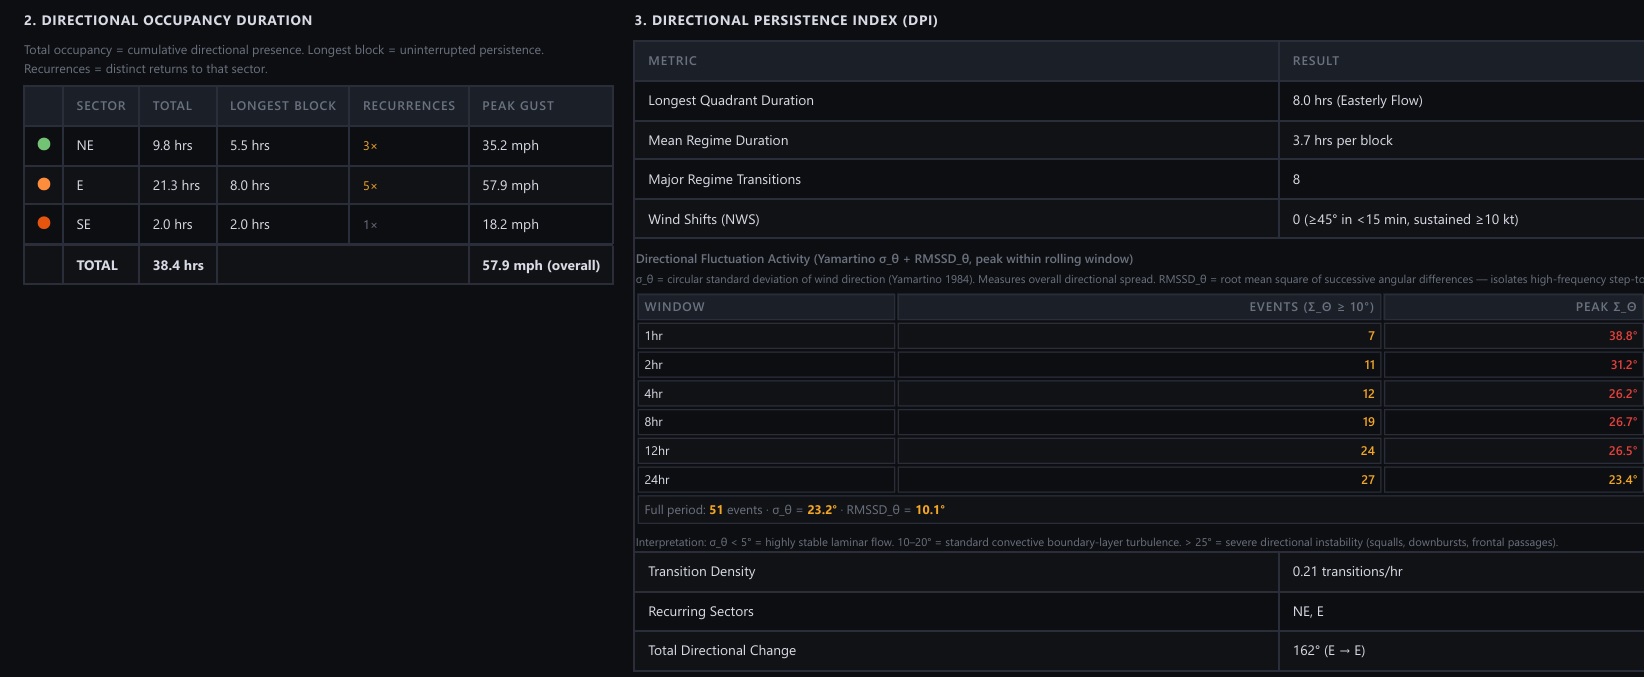
The occupancy table answers “which direction did the wind come from, and for how long?” For each direction it lists the total hours, the longest single stretch, how many separate times the wind returned to that direction, and the strongest gust from it. In this sample the wind was from the east for 21.3 hours in total, in blocks of up to 8.0 hours, returning five times, with a peak gust of 57.9 mph.
The persistence table on the right describes how steady or changeable the event was overall: how long a typical pattern lasted, how often the direction changed per hour, and how much the direction fluctuated within 1-hour, 2-hour and longer windows. A long stretch from one direction means the same side of a building faced the wind for a long time; repeated shorter returns mean it was hit again and again.
How the wind moved from one direction to the next
Sample report: Hurricane Ian, Fort Myers, FL, 2022-09-27 to 2022-09-28
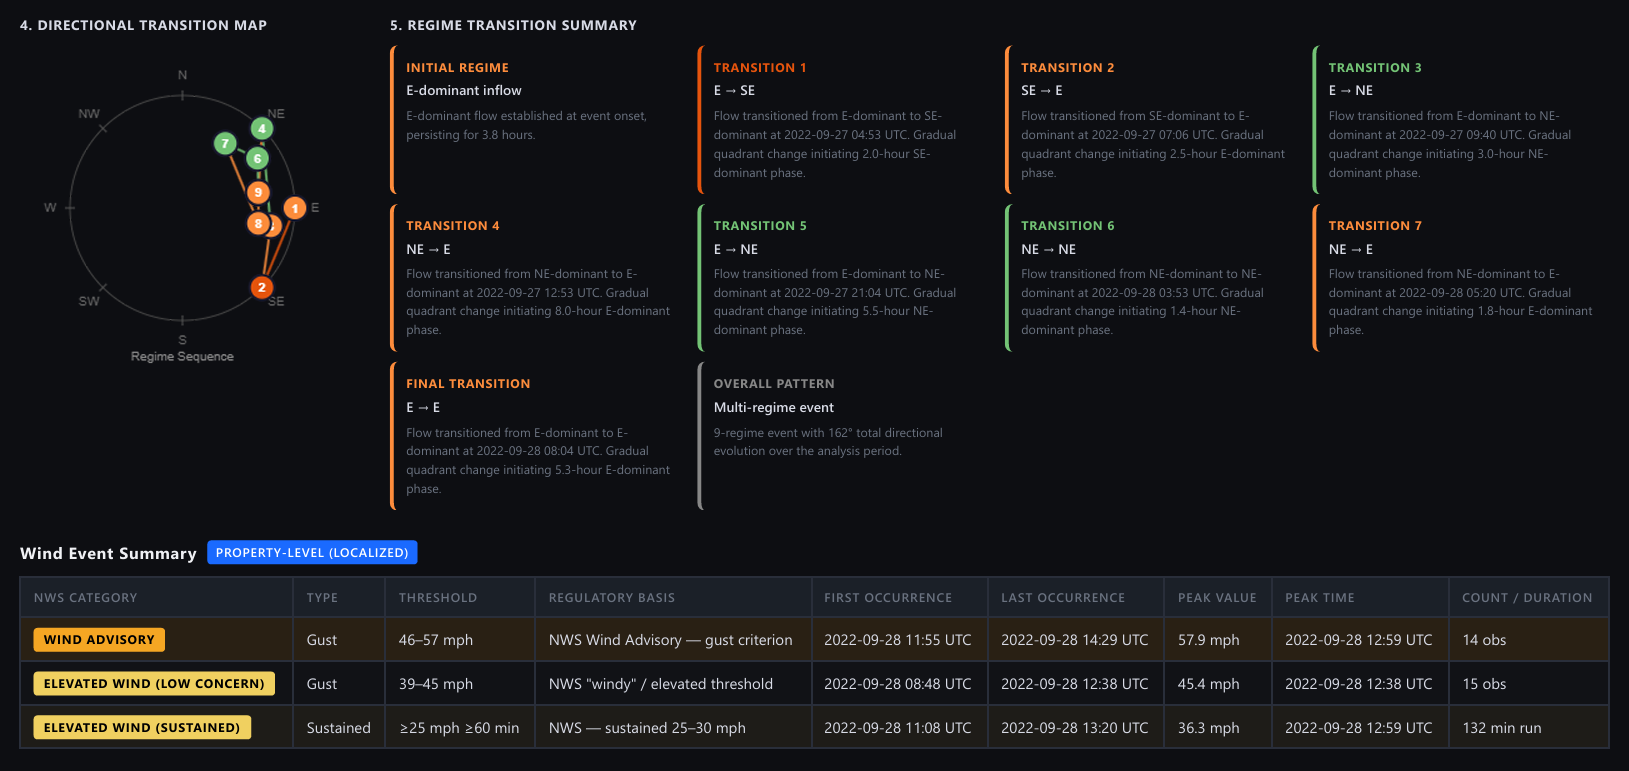
The transition map is a compass with numbered dots. The dots follow the order of the direction patterns during the event, placed where each one sat on the compass, and the lines join them in sequence. In this sample they stay clustered between northeast and southeast, which shows the wind swinging within that range instead of sweeping around the whole compass.
The transition summary cards put the same story into words: each one says what the wind changed from and to, and when the change began (in UTC time).
The wind event summary compares the estimated winds at the property with National Weather Service wind advisory criteria. For each category it shows how many readings reached it, when it first and last occurred, and the peak value and time. In this sample, gusts reached the advisory range of 46–57 mph in 14 readings, with a peak of 57.9 mph. Wind of 25 mph or more held for 132 minutes in a row, peaking at 36.3 mph. These categories are modelled on NWS criteria; they are not official warnings issued for the property.
What’s in a report
An analysis that shows its work.
Each section shows its inputs and its limits, so a reader can see how the answer was reached and how far to trust it.
- 01
All the observations
Every record from the nearest stations, time-stamped in UTC, with each value’s source labelled.
- 02
Estimated local & roof-level wind
Station winds adjusted to the property and to a typical roof height.
- 03
Exposure by direction
Land cover around the property is considered in each wind direction to estimate how sheltered or open it was.
- 04
Terrain effects
Nearby hills and ridges are checked, and an adjustment is applied only when the terrain calls for it.
- 05
Event summary
Gusts and sustained winds grouped into categories modelled on National Weather Service advisory and warning thresholds, with first, last and peak times.
- 06
Directional wind rose
Estimated peak gust and sustained wind by compass sector, drawn over satellite imagery of the property.
- 07
Direction timeline
How the wind direction shifted, and how long each pattern persisted, through the event.
- 08
Regional comparison
Neighbouring stations compared: do their peaks agree in size, timing and direction?
- 09
Confidence & limitations
Plain-language ratings of how much weight the data can bear, and the limits of the estimate.
How it works
From address to report in a few moments.
Four steps, no sign-up.
Enter an address and dates
Any US address, and any window of up to 92 days since 1990.
We gather the records
Nearby public station records are collected. Gaps filled from model data are flagged, never hidden.
We adjust for the site
Land cover and terrain around the address are used to adjust the readings to the property.
You save the report
Read it on screen and download the PDF. Reports aren’t stored, so keep your copy.
Now run it for your property.
Your address, your dates. Takes a few moments; no account.
Pricing
Pay per report. That’s it.
No subscription and no account. One payment runs one report.
Full report
- Every observation, every section
- Estimated local and roof-level wind
- Event summary, wind rose, direction timeline
- Regional comparison and confidence ratings
- Download as PDF
Free preview
- Wind rose for the whole period
- First 5 observations only
- No event summary, regional comparison, terrain effects or PDF
Questions
Before you run one.
Who is this for?
Homeowners, roofers, adjusters and engineers who want an estimate of the winds a specific address likely experienced during a specific event.
How accurate is it?
It is an estimate, not a measurement. Results depend mainly on how far the nearest station is, whether it kept reporting, and how the terrain and buildings around the property affect the wind. Stations can fail in a storm, as in the sample above. Every report shows the station distance, data gaps and any model-filled values, and rates its own confidence. Treat the numbers as indicative, never as exact.
What addresses and dates work?
US addresses, for any period of up to 92 days since 1990. The period must be in the past.
What do I get, and how do I keep it?
The full report on screen, plus a Download PDF button. Reports are not stored, so save the PDF when it finishes.
What about payment and privacy?
You pay once per report through PayPal. There are no accounts or subscriptions, and this site sets no cookies of its own. We don’t store your reports. We keep a record of each payment (order ID, amount, time and the PayPal payer email) so a paid report can’t be reused, and our servers keep standard operating logs. The home page loads satellite imagery directly from Esri. See the Terms of Use.
Will an insurer or court accept it?
We can’t promise that. A report is an estimate based on public weather data. It is not certified weather data, an official NWS storm report, or professional advice. Certified copies of NOAA records for legal use are available from NOAA’s National Centers for Environmental Information.
Estimate the winds at your address.
$4.99 per report · download the PDF · reports aren’t stored.
Wind values are estimates, not measurements. Terms