Property-specific wind analysis
Estimated winds at your property
Weather stations measure wind over open, flat ground, not at your address. ChartTheWind takes public station records for any US address and date range and adjusts them for the land cover and terrain around that property to estimate the winds it likely experienced.
You get a report you can save as a PDF: estimated peak gusts and sustained winds by direction, estimated local and roof-level wind, and how much confidence each estimate deserves. $4.99 per report, no account.
A real report
Hurricane Ian at the Lee County Courthouse, Fort Myers, FL
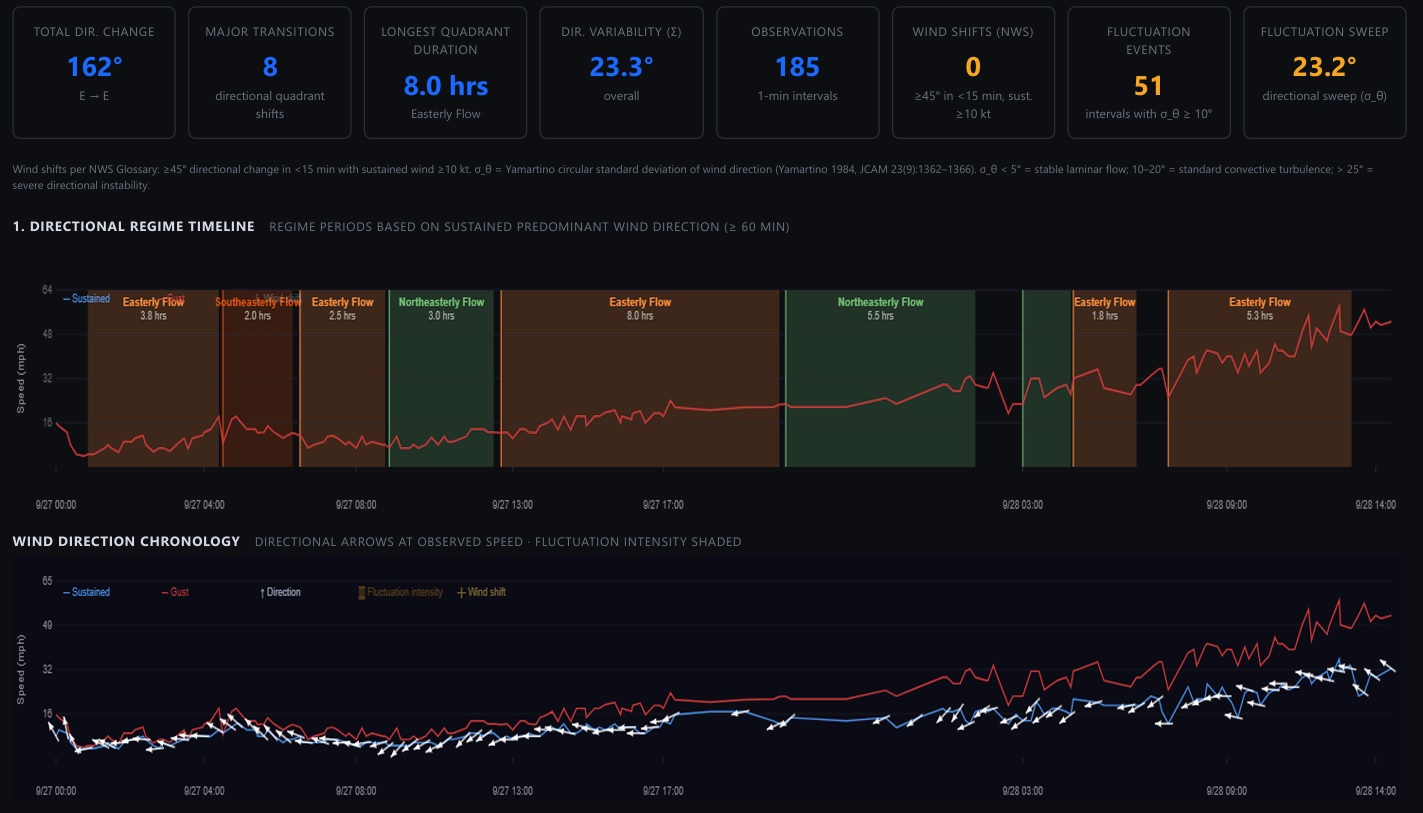
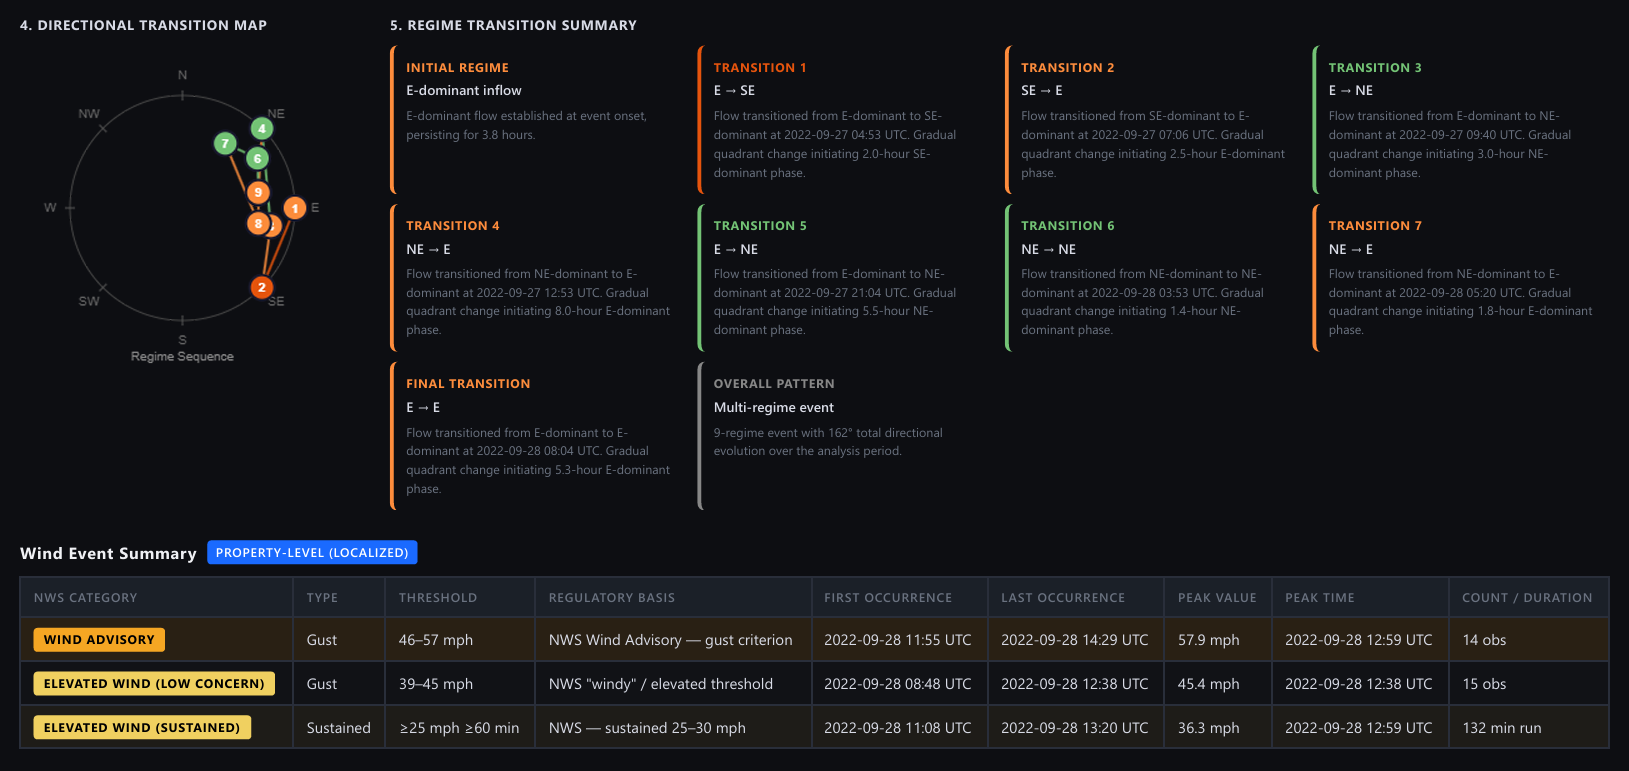
Estimated peak wind by direction at the property, September 27–28, 2022. The nearest station’s record ends at 10:29 AM EDT; neighbouring stations recorded 68 and 135 mph later. The full report lists each station’s peak and time. See the complete sample →
Petals show the estimated strongest wind from each direction (mph); length is scaled to each panel’s maximum.Imagery © Esri, Maxar, Earthstar Geographics & the GIS User Community
What a report includes
Run it for your property.
$4.99 per report · download the PDF · reports aren’t stored.
Wind values are estimates, not measurements. Terms